[Web Version]
The Prison Social Climate Survey Viewer
Updated 7/19/01
[Web Version]
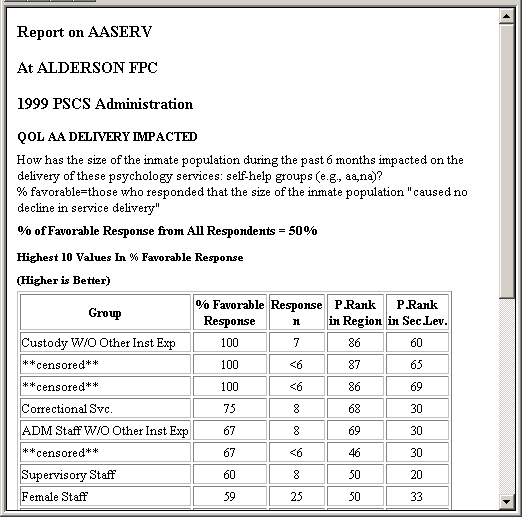
The Prison Social Climate Survey (PSCS) Viewer provides a mechanism to examine the results of the Prison Social Climate Survey, which is administered annually to BOP institution staff. Results are presented as the percentage of favorable response, abbreviated as "% Favorable", and percentile rank, abbreviated as "P.Rank", within corresponding region and security level. A favorable response for some items might be "always, very often or often" and "never, very rarely or rarely" for others. Percentage of favorable responses and rankings are computed for twenty-nine different respondent sub-categories in addition to the "All Respondents" category. Users can specify one or more sub-categories for use in creating the reports.
The important thing to remember in reviewing PSCS Viewer results is that, in all cases, the higher the number, the more favorable (for the BOP) the result. Regardless of the question, a 100 in the "% Favorable" column indicates that all respondents answered in a favorable fashion, a 0 that no one answered in a favorable manner. Likewise, the percentile ranking is arranged so that a 100 would represent the best score, and a 1 the worst.
The PSCS Viewer currently exists as two versions, the intranet application accessed via your favorite browser at http://kiss.bop.gov/pscsview and the stand alone version accessed via the Key Indicators CD-ROM..
Both versions share the same data sources and produce essentially the same reports. Although the two versions run in different settings they have been designed to have similar user interface characteristics. Both systems can generate three basic report types, whose interfaces are color coded using blue, red, and green:
When scanning across items within a facility, the scan can be limited to specific survey sections. When scanning across institutions, the scan can be limited to specific regions, security levels, or inmate population gender. Scanning across institutions using multiple sub-groups can be made faster by reducing the number of regions and/or security levels being scanned.
The User Interface
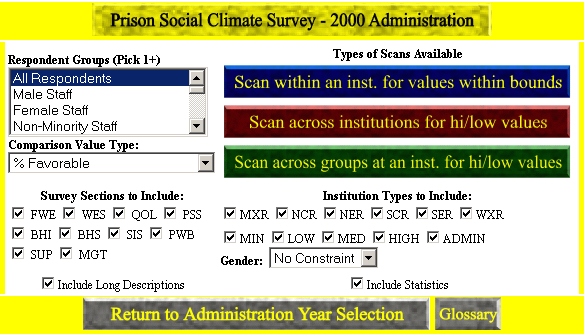
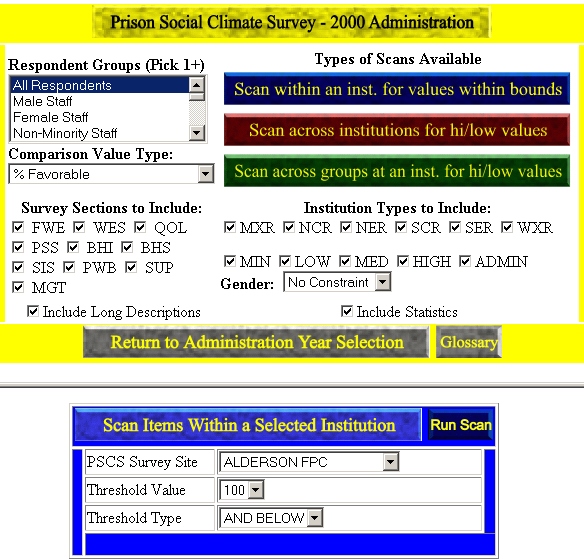
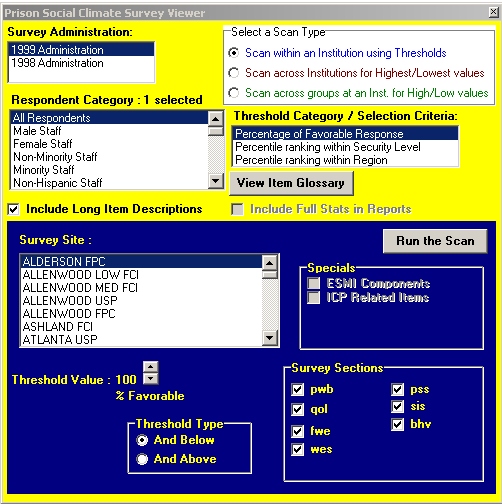
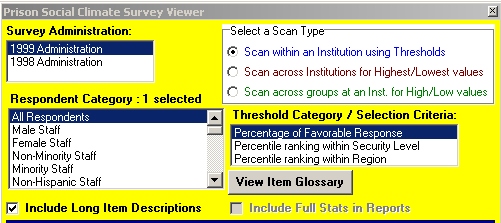
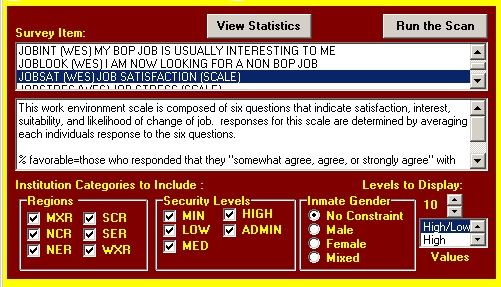
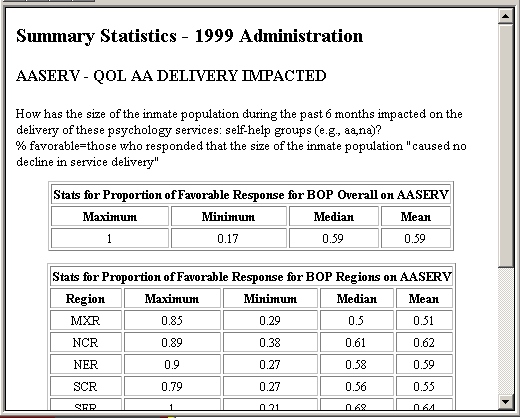
The user interface of both the stand alone version and the web version of the viewer consists of an upper and lower section of controls. Within the upper section of both versions, the user can select which respondent categories to include, what type of value to use for comparisons or thresholds, and which type of scan to be use in generating the result. There are also controls for selecting the survey sections of interest, and the characteristics of institutions to be included in scans and selection lists. Check boxes are used to indicate whether or not to include full item descriptions in the report, and whether or not to include overall statistics for single item reports.
Multiple respondent categories can be selected at the same time using the standard windows technique of using the "control" key in combination with the each mouse click while selecting.
The scan type selectors are color coded to match the corresponding lower section. The lower section will contain controls that are specific to the type of scan that was selected in the upper section.
Scan Within an Institution using Thresholds
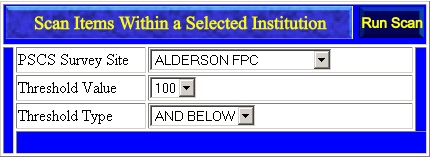
This is the scan that is used to look at all question items within a single facility, using a threshold value to determine which items will be included in the report. Users can look for all items which
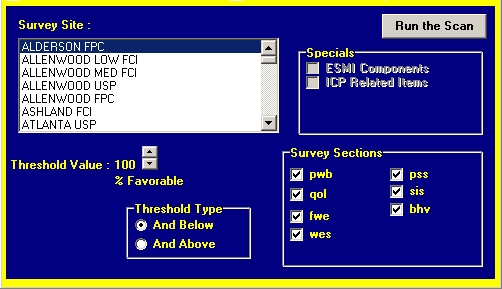
fall above or below the selected threshold value. By default, the threshold type is set to "and below" and the threshold value is set to 100 % favorable. All items at or below the threshold value are reported. Using a value of 100% results in a report that includes all items.
The lower section controls which institution will be examined. In the web version, the list of available institutions will be limited by the current region and security level check box settings found in the upper section.
The survey sections to be included in the report are controlled by the survey section check boxes. Each item in the survey is associated with a specific section represented by a three letter mnemonic. For example Quality of Life questions are noted as QOL items; Personal Safety and Security are PSS items; etc. In the CD version, the survey section check boxes are in the lower section, in the web version, they are found in the upper section.
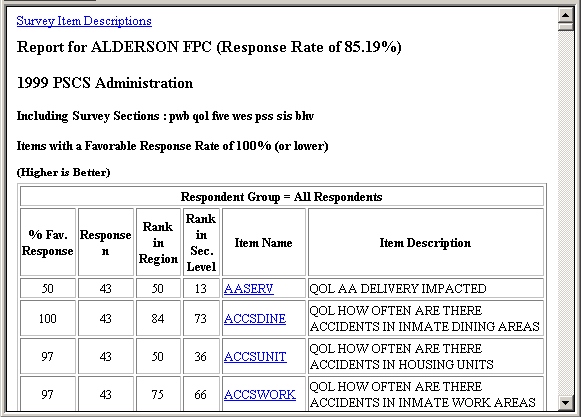
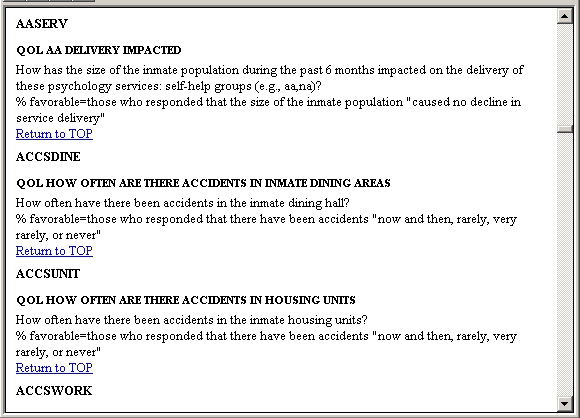
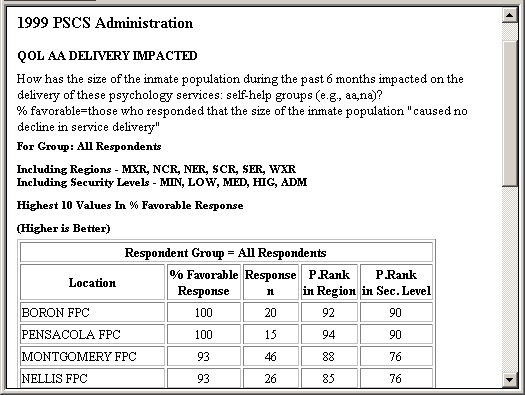
The resulting document will list all survey items which meet the criteria at the institution selected, for each of the respondent groups selected. In the report, survey items are listed using their shorthand name and a terse item description. If the "Include Long Descriptions" box has been checked, the shorthand item name will act as a link to a full description of the survey item. Individual survey item information includes the percentage of favorable response, the number of individuals who responded to items in that survey section, and the percentile rankings within that institution's region and security level based on results to that item. If more than one respondent category was selected, each respondent group will have its own table.
Scan Across Institutions for Hi / Low Values
[CD Version] |
[Web Version] |
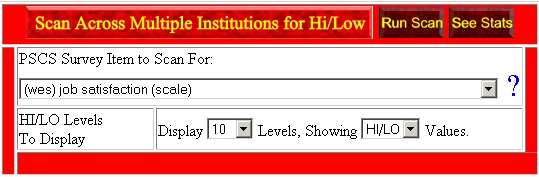
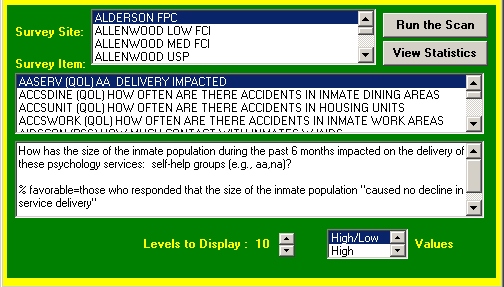
This scan is used to look across multiple institutions to find those locations with the highest and / or lowest numbers for a specified survey item. In addition to selecting the item to be examined, the user can choose to limit the scan to those locations that match criteria such as region, security level, and gender of inmates. The user can choose whether to view those locations with the highest values, those with the lowest, or both. They can also select the maximum number of locations in each category to include in the report.
As mentioned earlier, region and security level selection items have been moved to the upper panel in the web version. This permits the institution selection list to be limited to those corresponding to the currently selected regions and security levels. This can make it easier to locate similar institutions for comparison purposes when running the Within institution scan (blue) and the across groups scan (green).
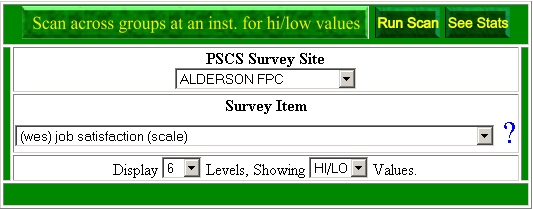
Scan Across Groups
Like the Scan Across Institutions operation, Scan Across Groups lists hi / low values for a specified survey item. The difference is that the scan occurs at a single institution and is conducted across the various respondent groups. The report will consist of those groups with the highest / lowest values on the selected survey item. As with other areas of the PSCS viewer, respondent groups smaller than six individuals are not identified by name or size.